How do you know if it’s worth investing in a new product or service idea? It may sound great…but is there actually an audience for it? And, will they actually spend money?
You estimate it’s potential market size. That’s how.
Market sizing is a strategic approach to estimating a business’s revenue potential. It tell individuals if it’s worth spending their time building a product, and it tells investors if it’s worth funding the team to build it.
However, there’s isn’t a one-size-fits-all approach to market sizing. You’ll need to choose between three different types of market sizing options and three different calculation approaches to find the best option for your product or service.
Market Sizing Options: TAM, SAM & SOM
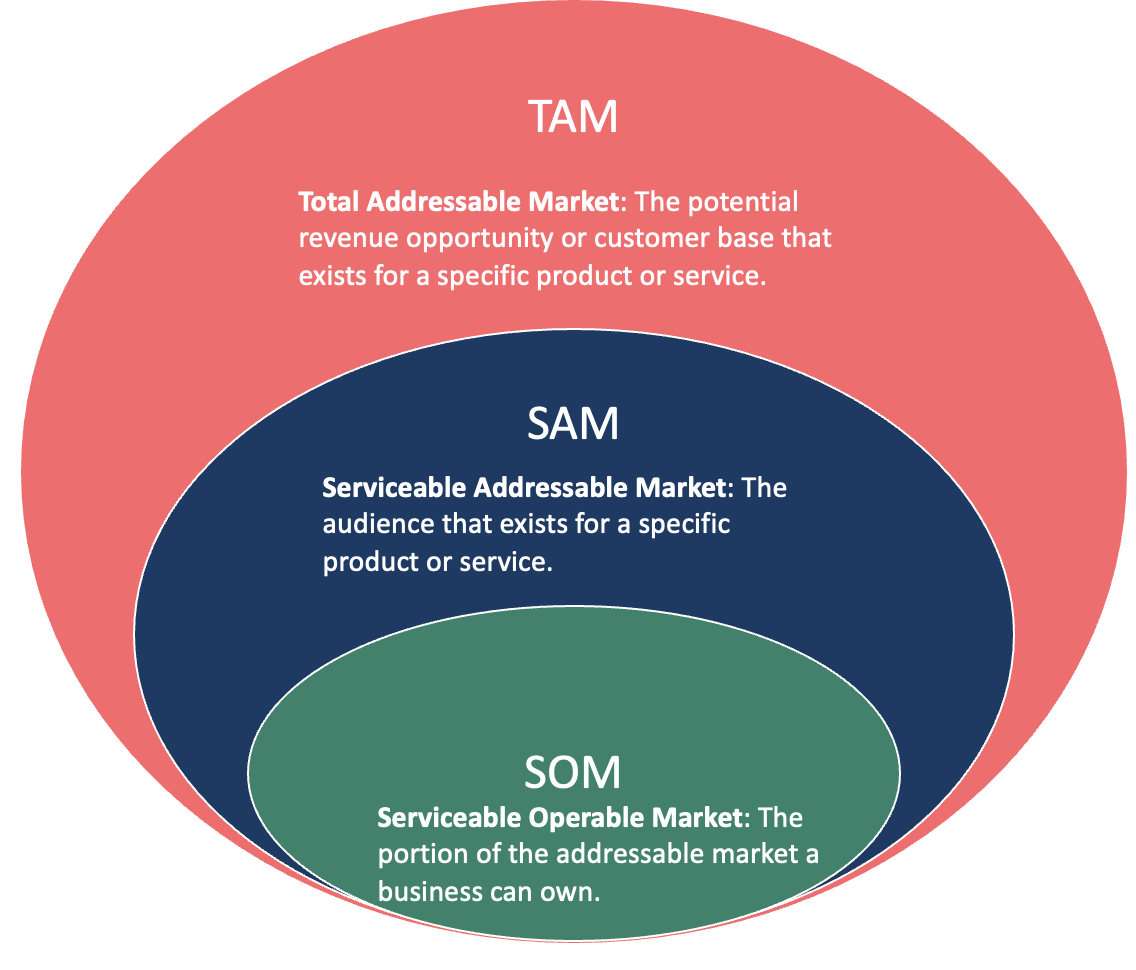
When it comes to market sizing, there are three options to use. Total Addressable Market (TAM), Service Addressable Market (SAM), and Service Obtainable Market (SOM). Let’s pick these three apart to better understand each one and their relative value.
What Is Total Addressable Market (TAM)
Total Addressable Market (TAM) refers to the potential revenue opportunity or customer base that exists for a specific product or service. Examples would be the yearly global revenue for light fixtures or the number of people across the world who bought toilet paper last year.
The TAM for any product or category is usually massive. It’s unrealistic that any organization would own 100% of the TAM. However, it’s a good starting point for understanding product-market fit and whether it’s worth creating or investing in a product.
What Is Serviceable Addressable Market (SAM)
Serviceable Addressable Market (TAM) refers to the audience available for a specific product or service. This is a subset of TAM and focuses on who would buy the product based on features, pricing, availability, and other factors. Examples would be the yearly global revenue for high-end light fixtures online or the market for scented, hemp-based toilet paper in natural grocers.
SAM starts getting to a more realistic number for a business’s actual opportunity. It factors in that product features and benefits target a specific audience or customer base. In doing so, it hones down on who would actually be interested in your specific offering.

What Is Serviceable Obtainable Market (SOM)
Service Obtainable Market (SOM) refers to the actual portion of the serviceable market that your product or service could own. This is a subset of SAM and takes into account additional factors like competition or resources (e.g. finances, people) the decrease a product’s or service’s potential market size.
As an example, we’d start with the yearly global revenue for high-end light fixtures online. But, to get SOM, we’d then look at factors like existing competition or advertising budget to see how much of that market a business could own. In the grand scheme of things, SOM homes in on the most realistic option. However, it often takes calculating TAM and SAM to get to a final SOM number.
How To Calculate Market Size
At the simplest level, addressable market is a basic calculation:
Market = Total Customers In The Entire Market X Average Revenue
But, how we go about figuring out total customer and average revenue is where things get interesting. We’ll be the first to admit you could leverage 3rd party findings from organizations like Gartner and IDC. It’s quick and easy, especially if they are published freely. However, many times you have to pay quite a bit to get their market reports. Further, they do not disclose how they arrived at their estimates.
Let’s say that option is off the table. That takes us to one of three other options:
1. Top Down…uses larger macro-economic factors and demographics.
2. Bottoms Up…isolates a smaller scenario and then extrapolates up to the larger market potential.
3. Value Theory…looks at the holistic benefits a product or service brings compared to existing options.
Let’s now do an exercise to show this in action. For instance, what if we want to find the TAM and SAM for a specialty CPG water brand that promises clearer skin. (Yes, it sounds absurd. But let’s go with it!).
Using Top Down Market Sizing To Calculate Market Size
The top down approach says start with larger macroeconomic or demographic data points. Then, use additional data points to cut that number down to a more targeted TAM number. Let’s do this exercise for our CPG product, assuming we’ll just be selling in the US.
- Total Number of Americans: 330 Million (US Census)
- % of Americans over the age of 15: 80% (Statista)
- % of Americans that purchase bottled water: 94% (BottledWater.org)
As a starting point, this tells us that 248 million Americans who can control their spending bought bottled water over the past year.
But, we have to keep going since we’re looking at the specialty or functional water market.
- Functional Water’s market share in the Bottled Water Market: 15% (Guess)
This takes us to a much smaller market size of: 37 Million. At this point, we have a high level TAM number.
But, we need to keep going. After all, we need to figure who, among this group, would want water that improves skin. This gets us to the serviceable market.
Ideally, we’d now jump into primary market research. We’d survey consumers who made a functional water purchase in the past year to see what percentage would be interested in a functional water with this particular set of benefits.
- % of functional water buyers interested in skin-clarity water: 5% (Guess)
That takes us to about 2 Million Americans. We now need to get to revenue potential. Let’s say during the same survey, we asked about purchase frequency intent and willingness to pay. And, let’s assume the data tells us people would buy this water 8 times a month and would pay $2.99 per bottle.
- 2 Million X 12 months X 8 purchases per month X $2.99 = $287 Million
Our top down approach shows us a $574 million SAM opportunity.
Using Bottoms Up Market Sizing To Calculate Market Size
Calculating market size via the bottoms up approach means we need to first start with microlevel data points and extrapolate up.
This time around, we’re going to start with category-specific data points to understand interest in our unique bottled water product.
- Per capital consumption of functional water in the US 7.5 Liters (Statista)
- Average US bottle water size: 500 ml (Swell)
This tells us that the average American buys 15 bottles of functional water per year. But, let’s keep in mind we need to know how many would buy our specialty skin water. Let’s go back to that primary research we pretended to do in our top down approach.
- % of functional water buyers interested in skin-clarity water: 5% (Guess)
This tells us that the average American will buy .75 bottles of our speciality water per year. Assuming 330 Million Americans and a $2.99 price point yields a $740 million total serviceable addressable market opportunity.
Using Value Theory Market Sizing To Calculate Market Size
As you saw with the bottoms up and top down approach, we used known market numbers. This is because the bottled water category and functional bottled water categories are well understood known. Additionally, customers are very familiar with them and can easily state their preferences.
What do you do if this isn’t the case? What if the product or service you’re exploring is so novel that there aren’t fixed data points to use for your market estimates?
This is where the value theory approach comes in. It estimates the value a customer has for a product based on what it might replace or how it might augment their life. Think iPhones and iPods or Netflix in their early heydays.
For this, we take replacement categories (e.g., Blockbuster for the video rental category) and understand consumers’ consumption patterns with those known categories. We then estimate how those patterns would evolve (e.g. Netflix monthly subscription service vs. one-off rental) given the features of our new product.
Choosing A Market Sizing Approach
We just gave you three ways to calculate market size. Which should you use?
Let’s start with an easy if/then statement.
If…you’re creating something extremely new/novel, then use the value theory approach.
If not…use top down or bottoms up.
That leaves us with deciding between a top down or bottoms up approach for more established category market sizing. Ideally, you do a bit of both. We like bottoms up because it takes a more consumer-centric approach. It relies on micro-level consumption or usage patterns to calculate market size. But, the top down approach factors in broader macro-level factors that impact market potential too.
When you calculate market size with both approaches, you can then take the average of the two. This moderates estimation uncertainty and often yields a more reasonable market size number somewhere in the middle.


