What Is A Conjoint Analysis
A conjoint analysis is a market research approach that helps you understand how people make decisions. With conjoint analyses, you can identify how people make trade-offs that impact their preferences.
In essence, it aims to replicate the real-time decisions individuals make during any purchase decision. Customers are faced with many products or services in any given category. And, each of these likely come with different features, benefits, and price points. By understanding how customers prioritize these elements, you can develop options that increase their likelihood to buy.
Business Questions Answered By Performing A Conjoint Analysis
How do you know if a conjoint analysis is right for you? When talking to prospective clients, we keep our ears open for a few key business questions. These are….
- • What features should we release?
- • What benefits are most compelling?
- • How sensitive are customers to price changes?
- • Do any features, benefits, or price points alienate customers?
- • What is the best mix of features, benefits, and price to optimize purchase interest?
If you find yourself asking these questions, especially when planning for a new product release, chances are a conjoint is worth considering.
What You Learn When Performing A Conjoint Analysis
Let’s now breakdown exactly what kind of information you’ll learn when you run a conjoint analysis. For the sake of making things tangible, we’ll pretend we have a financial services company considering launching a new payment product. We need to know how important certain features are to customer preference. Additionally, we want to understand sensitivities to changes in price and features.
Preference Importance
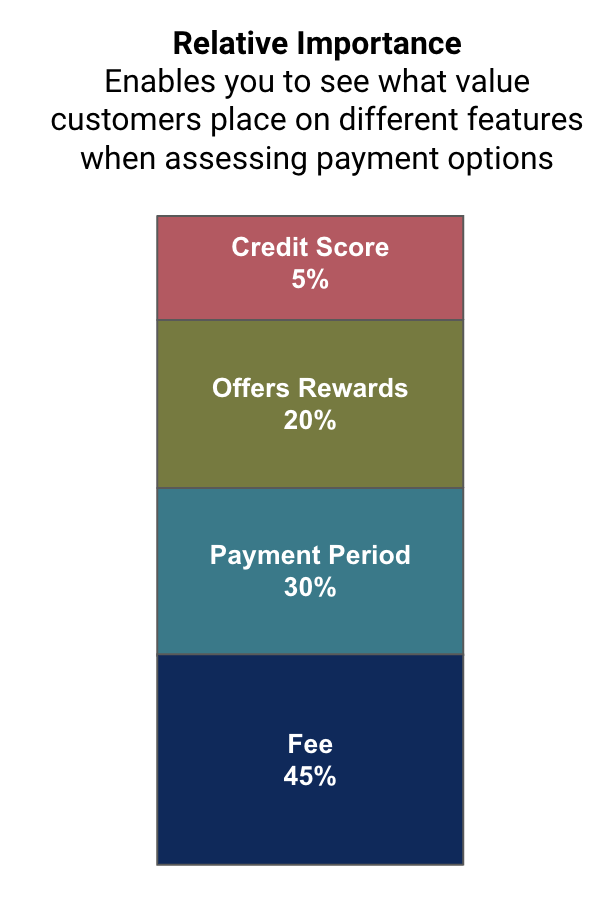
A key learning you’ll get from running a conjoint analysis is something called preference importance. Preference importance lets you see how important individual features are to customers’ purchase decisions. A high importance means that feature has a very strong influence on purchase decisions. In contrast, a low importance means it has very weak influence.
In the case of our pretend financial services company, we see that Fee holds a 45% importance preference. This high importance value tells us that customers really care about the product’s fee when deciding whether or not to buy. Meanwhile, Credit Score holds a 5% importance. This tells us that it has some, but very little, impact on our customer purchase decision.
In essence, preference importance tells us that the best way to improve purchase consideration is to look at the product’s Fees. Our mocked up data also shows us that we can improve consideration with changes to Payment Period and, to a lesser extent, Rewards. But, it tells us that changing Credit Score won’t have a material impact.


Preference Share
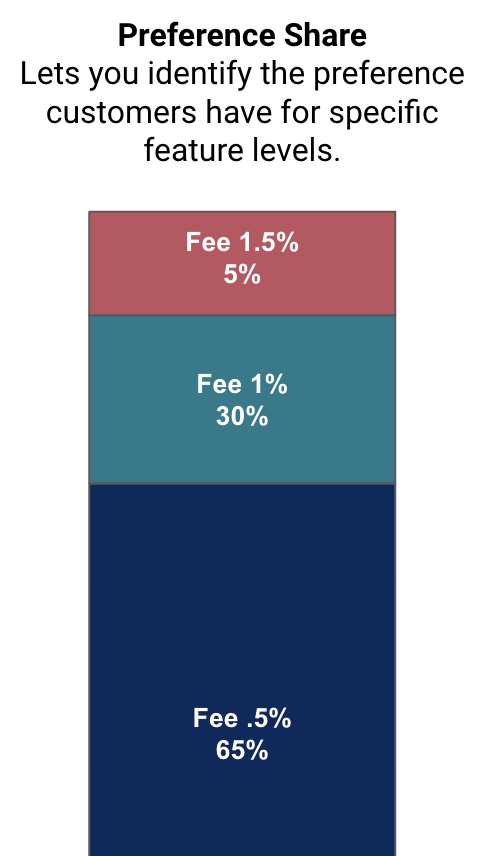
Another learning you’ll get from a conjoint analysis is the preference share within a given feature. Preference share shows how much a given level is preferred over other levels. A high share means that a particular level is very strongly preferred. In contrast, a low share means it not at all preferred.
Let’s look at this again in the context of our financial services company. This time, we’re going to home in on the Fees feature. Specifically, we’ll see how much customers prefer paying one fee amount versus others. In this example, customers have a very strong preference for low fees. This is why a fee of .5% has a 65% share while a fee of 1.5% has a 5% share.
This outcome isn’t very surprising. Customers always want to pay less. However, when performed for other features (e.g. payment periods), we may see that customers are more balanced in their preferences.
Relative Utility
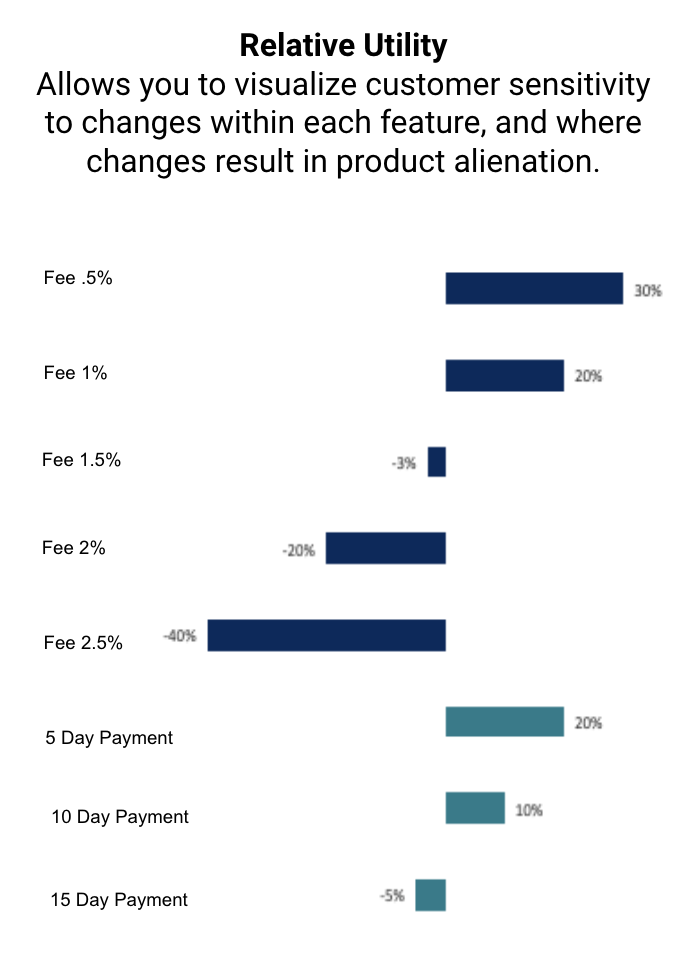
Lastly, running a conjoint analysis lets us understand the relative utility of levels within each feature. Said more simply, it lets us identify how sensitive customers are to changes in feature levels. And, it shows when changing certain levels really alienates customers.
Once again, let’s look at this for our financial services company. In this example, a .5% fee has a higher relative utility than a 1% fee. However, both of these options have a positive utility. That is, going from .5% to 1% still results in positive customer interest, albeit the fee hike does decrease interest a bit. However, when the fee goes to 1.5%, the story changes. There is now a negative utility. This means we are alienating customers.
Relative utility lets us see how elastic or inelastic customers are to feature changes. In the case of Fees, we’re seeing a lot of elasticity. This means that customer demand changes a lot when fees increase or decrease. Meanwhile, customers are less elastic when it comes to Payment Day. We can infer this because the graph shows far narrower shifts in relative utility as payment days change.
This represents a valuable insight for businesses looking for ways to improve a product’s economics while increasing customer demand. It tells them which features they can change the most and still keep customer interest high.

How To Perform A Conjoint Analysis
Without getting too deep into the weeds, let’s walk through the standard approach for performing a conjoint analysis.
Develop List Of Features & Feature Levels
First things first, you need to determine the specific features you want to test. In the case of our financial services company, this would be things like payment periods, fees, rewards, etc. Then, you need to figure out what levels within those features you want to test. For instance, you may want to look at 10-day, 15-day, and 20-day payment periods. Or 1% versus 2% versus 3% fees.
Build A Digital Survey To Capture Input
Using a digital survey tool, we program these different features and feature levels to capture the data needed for subsequent analysis.
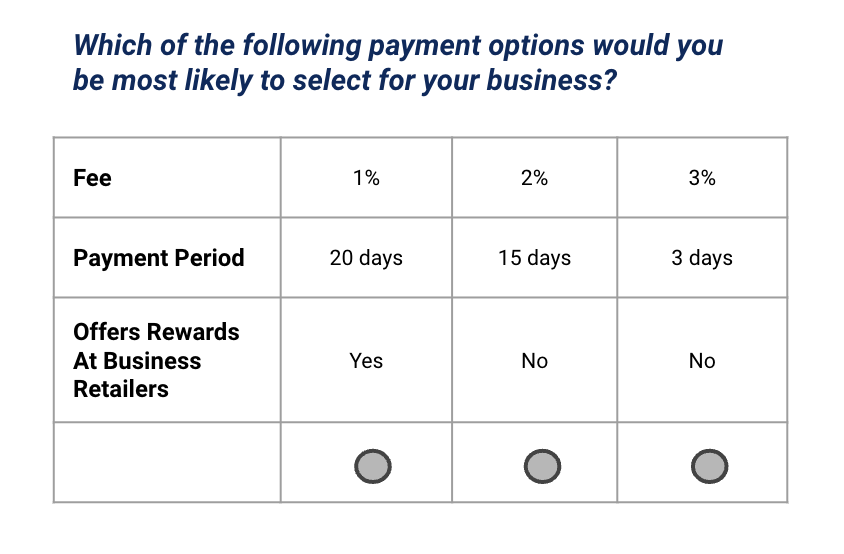
When taking the survey, respondents see unique product bundles that mix and match different feature levels. For instance, one product may show a 1% fee and a 30-day payment period. Another may show a 3% fee and a 5-day payment period. Respondents select their preferred options.
The bundle options then refresh so that respondents see a new set of bundle options. Once again, they select their favorite bundle. This process repeats multiple times across all respondents.

Analyze The Results Input
Once the data is in, we can dig into learning the preference importance, preference share, and relative utility of different features and feature levels. Additionally, if sample sizes permit, we also look at findings by unique segments. This tells us if individual customer groups have different preferences and elasticities.
Alternatives To A Conjoint Analysis
A conjoint analysis is extremely powerful. But, sometimes it’s overkill.
When organizations are in the early days of developing a product or service, you may not even know what features to include. As a result, it’s far too early to dive into testing feature importance, let alone the relative utility of feature levels. Instead, you’re likely better off doing product concept tests. This “dip your toe in the water” approach offers initial validation before you get too entrenched in a product idea.
Or, you may have a list of high-level features but aren’t sure which ones truly matter. In this scenario, you’re not ready to test feature levels. You just need to understand the relative value of unique features. If you find yourself in this instance, consider a MaxDiff study instead. This approach gives you clear insight into what features customers really want, and which ones they’re comfortable leaving behind.


